Posted on

Coffee: Health and Performance Impact

Coffee: Health and Performance Impact

Other than water, coffee is the most consumed beverage in the USA. Americans drink more coffee than any other nation – over 400 million cups per day. Whether you are a die-hard coffee drinker or a casual sipper, read on for a detailed review of coffee health and performance impact, and some practical advice.

  • Beyond the stimulating effects of caffeine which can improve exercise performance, there are many health beneficial chemical compounds in coffee. These include antioxidants, minerals, pro-vitamins, and polymers which behave somewhat like other dietary fiber.
  • For healthy, non-hypertensive adults, the potential heart protective benefits of coffee appear to outweigh the risks based on meta-analysis of human observational studies. Anywhere from 2-5 cups per day appears to be a sweet spot for cardiovascular disease risk reduction.
  • Decaf coffee and tea offer many of the same health protective benefits of coffee if you don’t like coffee or want to reduce caffeine consumption.
  • If you are attempting to reduce cholesterol by making dietary changes, swapping from unfiltered type coffees (e.g. espresso, french press) to filtered coffee might be worth exploring. Filtration will remove diterpenes, which can have a total and LDL cholesterol raising effect.
  • Coffee is not an effective tool for weight loss, but may help mitigate long-term weigh gain.
  • If you are interested in exploring caffeine to enhance exercise session performance, supplementation with 200-400 mg caffeine appears to be the most effective dose range for most people, taken approximately one hour before training. Personal experimentation on dose is warranted. If you choose to use coffee, a 16 oz. regular coffee is within the dosage range.

There are over 1,000 bioactive micronutrients in coffee. The concentration of these compounds can vary substantially depending on the beans, roasting process, and brew process. The most well-studied:

Caffeine

A stimulant of the central nervous system, caffeine indirectly affects the release of neurotransmitters which alters mood, memory, alertness, and cognitive function by blocking adenosine receptors. Caffeine content in coffee varies substantially depending on the bean and preparation method (see table at end of this post for estimated caffeine content of different coffees). Even decaf coffee has a small amount of caffeine.

Chlorogenic Acids (CGAs)

CGAs are a subset of naturally occurring polyphenolic compounds found in coffee beans and many other plants. Metabolized products of CGAs can induce antioxidant and anti-inflammatory effects. In espresso or other higher-pressure extraction processes such as a moka pot, CGA content can be much higher due to the larger amount of coffee is used per volume of water versus brews prepared by drip filter. CGA content will also be higher with beans that are lighter roasted. Generally, cold brews with short infusion periods and lower temperatures tend to yield lower CGA levels.

Melanoidins

Melanoidins are polymeric compounds formed during the coffee bean roasting process from a reaction of carbohydrates, amino acids, and phenolic compounds.  They contribute to the sensorial properties of coffee via the Maillard reaction which is the thermal process of “browning” (the same is responsible for the crust on bread, searing on steak). A diet rich in coffee, bread, and cereals can provide up to 10g of melanoidin per day. Interestingly, melanoidins seem to act much like dietary fiber in the colon and contribute to gut health.

Cafestol and Kahweol

Cafestol and Kahweol are esterified fatty acid compounds that impart some of the oily texture of coffee. These compounds are retained in unfiltered coffee, but largely removed in filtered coffee. Cafestol and Kahweol can have total and LDL cholesterol raising effects, but on the other hand also demonstrate potentially beneficial anti-inflammatory and anticarcinogenic activity. Further research is needed on the pharmacological properties of these compounds.

Trigonelline

A vitamin B3 (niacin) precursor that gives coffee some of its bitter taste and can help upregulate our antioxidant defense system. Trigonelline may have therapeutic potential as a hypoglycemic, neuroprotective, and anticarcinogenic agent per rodent models and limited studies. More research in the area is required to better elucidate the action of trigonelline within coffee.

The mineral content in coffee varies considerably depending on the bean, brew method, and of course the water source. A review of research spanning 2000 – 2020 notes that one portion of coffee brew can cover 7.5% or 6.4% (for women and men) and 6.6% of the daily requirement for magnesium and potassium, respectively. Coffee provides slightly lower amounts of phosphorus (up to 2.2%), sodium (up to 2.2%), and calcium (up to 0.7% of the daily requirement for women and 0.6% for men).1

A dose-response meta-analysis of observational, prospective cohort studies (35 studies comprising 1,283,685 participants analyzed) conducted by Ding et. al indicates a J-shaped non-linear relationship between coffee consumption and risk of CHD and stroke.2 cardiovascular disease (CVD), with modest effect. Lowest risk was associated with consumption of 3-5 cups/day.

The “J-shape” of the curve likely reflects a combination of beneficial and detrimental effects. For moderate coffee consumption; beneficial effects may be greater than adverse effects; whereas for heavy consumption, detrimental effects may counterbalance beneficial effects.

No association was found with decaffeinated coffee and CVD risk, however this may be related to reverse causation (people with CVD-related conditions may switch from regular coffee to decaf), or that the overall consumption of decaffeinated coffee is much lower than caffeinated coffee, providing a less significant pool of data. It’s also worth noting that tea consumption (3 cups/day) is associated with reduced risk of coronary heart disease.3

There does not appear to be a significant dependency on age. Certain previous studies in the scientific literature conflict with these findings.5 However, these studies do not appear to have risk-adjusted for enough cofounding health-related variables. Given the effect size of coffee on CVD risk is only mild to moderate, it stands to reason that statistical adjustments and assumptions within individual studies can lead to divergent findings.

Coffee can acutely raise blood pressure by the action of caffeine, more notably in individuals who are not habituated to caffeine. These effects are typically transient, with blood pressure returning to normal level within a few hours. A recent metanalysis found no long-term blood pressure raising effects of coffee.6 A large prospective study in non-hypertensive female nurses found that coffee consumption mildly reduced risk hypertension risk.7

Although caffeine has an acute hypertensive effect, the other active compounds found in coffee in tea may have an anti-hypertensive effect (such as chlorogenic acids, soluble fiber, and potassium) which could exert a beneficial effect in the cardiovascular system. Green and black tea has also been shown to reduce blood pressure for individuals who are pre-hypertensive or hypertensive.8

Heavy coffee consumption was associated with an increased risk of CVD mortality among people with severe hypertension,9 but not people without hypertension. In contrast, green tea consumption was not associated with an increased risk of CVD mortality across all categories of blood pressure. Although the precise nature of the relation between coffee and blood pressure is still unclear, most evidence suggests that regular intake of caffeinated coffee does not increase the risk of hypertension, in non-hypertensive individuals.

Chlorogenic acids can reduce fasting plasma glucose concentrations, increase sensitivity to insulin, and slow the appearance of glucose in circulation after a glucose load. A systematic review of nine cohort studies compared minimal to low coffee consumption (<2 cups/day) with that of heavy coffee consumption (>6 cups/day) for the risk of the development of type 2 diabetes mellitus (T2DM). The study concluded that the risk of the development of T2DM was lowest in subjects who drank >6 cups daily but also significantly reduced in subjects who consumed 4-6 cups per day.10 A prospective study of >88,000 women 26 to 46 years of age established a linear relationship of coffee consumption with the reduction in T2DM, whereby even small amounts of daily coffee conferred benefit. Associations were similar for noncaffeinated and caffeinated coffee.11

Green tea consumption has also been shown to reduce the risk of T2DM, which is possibly mediated through the antioxidant and anti-inflammatory effects of catechins. A 2020 meta-analysis showed that green tea significantly reduces the incidence of T2DM; however black tea did not. The authors concluded that different types of tea have varying protective mechanisms on metabolic syndrome although the explanation for this observation is unclear.12

Contributing to the bitter taste of coffee, cafestol and kahweol are natural diterpene fatty esters extracted from coffee beans, and the concentrations of these compounds is strongly influenced by the preparation method.  They are present are present in larger amounts in unfiltered coffee such as Turkish coffee, cold press, and espresso. They are mostly removed when coffee is filtered, or during processing in the case of instant coffee.

A meta-analysis of 14 randomized controlled trials examining the effect of coffee consumption on serum cholesterol concentrations indicate that the consumption of boiled coffee dose-dependently is associated with higher serum total and LDL cholesterol concentrations, while the consumption of filtered coffee results in slight increase in serum cholesterol.13  Cafestol seems to be the more potent actor in elevation of serum cholesterol.

Studies to date indicate a very small but not insignificant association between coffee consumption and suppression of fat accumulation leading to lower long term weight gain.14, 15, 16 To understand how coffee can potentially mitigate weight gain, consider the action of the constituents:

Coffee’s potential impact on energy expenditure

Caffeine elicits thermogenesis (production of body heat), increases the energy cost of movement resulting in increased total daily energy expenditure, resting metabolic rate, and exercise activity expenditure. The impact appears to be dose dependent, even caffeine doses of 100 mg can induce an increase in resting metabolic rate of 3-4%. The magnitude of energy expenditure increases near linearly with caffeine quantity; doses of 200-250 mg increases RMR by 10-12%. For reference, a 5% increase in RMR within a 24-hour period represents and additional expenditure of 75-100 kcal/day depending on the individual (it appears that dosage should be based on body weight versus absolute values). This may seem like a small number, but accumulated over weeks, months, and years it is a viable hypothesis for caffeine to mitigate weigh gain over time.

A 2023 prospective cohort study investigated coffee consumption and weight gain. Increase in intake of unsweetened caffeinated and decaffeinated coffee was inversely associated with weight gain, and each 1 cup per day increment in unsweetened caffeinated coffee was associated with a reduction in 4-y weight gain of -0.12 kg. The addition of sugar to coffee counteracted coffee’s benefit for possible weight management.17

Coffee’s potential impact on energy intake and appetite control

The impact of coffee on intake and appetite is not clear. There are some plausible mechanisms by which coffee could potentially reduce energy intake or appetite. Compounds in coffee could decrease the rate of gastric emptying, causing food to stay in your stomach longer promoting satiety. Coffee could alter the secretion of certain hormones, specifically 1) downregulating ghrelin (a gastric hormone that stimulates appetite, 2) upregulating PYY (released in the intestinal tract to suppress hunger), 3)  upregulating leptin a hormone released mainly from fat cells which supports feeling of satiety. Caffeine specifically could reduce appetite by increasing the release of adrenaline and cortisol. On the other hand, some report appetite stimulation from caffeine.

Very few studies that have examined caffeinated coffee consumption reduces appetite and energy intake, and those that are available are contradictory in their results. In a small, limited study decaffeinated coffee yielded significantly subjective lower hunger during the whole 180- minute study period and higher plasma PYY for the first 90 minutes versus water placebo.18 Caffeine in water had no effects on hunger or PYY. Caffeinated coffee showed a pattern between that of decaffeinated coffee and caffeine in water. There were no significant changes in ghrelin or leptin. In another limited study, a moderate coffee amount (2- 4 cups, 6 mg/kg body weight reduced reduce energy intake in the following meal and in the total day compared to lower or no coffee intake in overweight/obese participants but had no impact on normal-weight individuals.19

One rodent model study may provide us some understanding of complex nature of the relationship between caffeine and hunger.20 Caffeine administered acutely to mice at moderate to high doses can increase binge eating when the subjects had already stablished a pattern of excessive eating. However, this same dose led to clear reductions in food consumption if the mice were in an environment promoting high anxiety levels. Another consideration is fatigue – one the effects of caffeine wear off; appetite may be stimulated due to tiredness.

Caffeine: supplementation with caffeine can provide a degree of performance benefit, most notably increase time to exhaustion when aerobic and muscular endurance or is required,21 or sleep deprivation is considered. Effective dosages typically fall within the range of 3-6mg/kg of body weight22 – this is about 200 – 400 mg for a 150 lb. individual. It takes some experimenting to find the appropriate personalized dosage as some are more sensitive to caffeine than others. The recommended timing for ingestion is about one hour before exercise.

As a reference, here is the average caffeine content of different coffees, normalized per fluid ounce and then reported on a typical serving basis. Note that the values reported here are averages – caffeine content can vary *substantially* by coffee bean type and brewing conditions.

Regarding the role of chlorogenic acids and other bioactive compounds to mitigate oxidative stress (protein, lipid, and DNA damage) and mediate antioxidant capacity, data is limited and results are conflicting related to the lack of control on types of coffee and dosage, brew procedures as well as biomarker test methodology.

Hope you found this post informative! Reach out anytime with questions.

Instagram: @kmcgrath.phd Facebook: @1modusenergy

Ready to start?

Get started with nutrition coaching


1. Olechno E, Puścion-Jakubik A, Socha K, Zujko ME. Coffee Brews: Are They a Source of Macroelements in Human Nutrition? Foods. 2021 Jun 9;10(6):1328. doi: 10.3390/foods10061328.

2. Ding M, Bhupathiraju SN, Satija A, van Dam RM, Hu FB. Long-term coffee consumption and risk of cardiovascular disease: a systematic review and a dose-response meta-analysis of prospective cohort studies. Circulation. 2014 Feb 11;129(6):643-59.

3. Zhang C, Qin YY, Wei X, Yu FF, Zhou YH, He J. Tea consumption and risk of cardiovascular outcomes and total mortality: a systematic review and meta-analysis of prospective observational studies. Eur J Epidemiol. 2015 Feb;30(2):103-13.

4. Mostofsky E, Rice MS, Levitan EB, Mittleman MA. Habitual coffee consumption and risk of heart failure: a dose-response meta-analysis. Circ Heart Fail. 2012 Jul 1;5(4):401-5.

5. Liu J, Sui X, Lavie CJ, Hebert JR, Earnest CP, Zhang J, Blair SN. Association of coffee consumption with all-cause and cardiovascular disease mortality. Mayo Clin Proc. 2013; 88:1066–74.

6. Han M, Oh Y, Myung SK. Coffee Intake and Risk of Hypertension: A Meta-Analysis of Cohort Studies. J Korean Med Sci. 2022 Nov 21;37(45):e332.

7. Winkelmayer WC, Stampfer MJ, Willett WC, Curhan GC. Habitual caffeine intake and the risk of hypertension in women. JAMA. 2005 Nov 9;294(18):2330-5.

8. Yarmolinsky J, Gon G, Edwards P. Effect of tea on blood pressure for secondary prevention of cardiovascular disease: a systematic review and meta-analysis of randomized controlled trials. Nutr Rev. 2015 Apr;73(4):236-46.

9. Teramoto M, Yamagishi K, Muraki I, Tamakoshi A, Iso H. Coffee and Green Tea Consumption and Cardiovascular Disease Mortality Among People With and Without Hypertension. J Am Heart Assoc. 2023 Jan 17;12(2):e026477. doi: 10.1161/JAHA.122.026477.

10. Huxley R, Lee CM, Barzi F, et al. Coffee, decaffeinated coffee, and tea consumption in relation to incident type 2 diabetes mellitus: a systematic review with meta-analysis. Arch Intern Med 2009;169:2053–63.

11. van Dam RM, Hu FB. Coffee consumption and risk of type 2 diabetes: a systematic review. JAMA 2005;294:97–104.

12. Liu W , Wan C , Huang Y , Li M . Effects of tea consumption on metabolic syndrome: a systematic review and meta-analysis of randomized clinical trials. Phytother REs 2020;34(11):2857–66 .

13. Jee SH, He J, Appel LJ, Whelton PK, Suh I, Klag MJ. 2001. Coffee consumption and serum lipids: a meta-analysis of randomized controlled clinical trials. Am J Epidemiol 153:353–362.

14. Larsen SC, Mikkelsen ML, Frederiksen P, Heitmann BL. Habitual coffee consumption and changes in measures of adiposity: a comprehensive study of longitudinal associations. Int J Obes (Lond). 2018 Apr;42(4):880-886.

15. Nordestgaard AT, Thomsen M, Nordestgaard BG. Coffee intake and risk of obesity, metabolic syndrome, and type 2 diabetes: a Mendelian randomization study. Int J Epidemiol 2015; 44: 551–565.

16. Lopez-Garcia E, van Dam RM, Rajpathak S, Willett WC, Manson JE, Hu FB. Changes in caffeine intake and long-term weight change in men and women. Am J Clin Nutr 2006; 83: 674–680.

17. Henn M, Glenn AJ, Willett WC, Martínez-González MA, Sun Q, Hu FB. Changes in Coffee Intake, Added Sugar and Long-Term Weight Gain – Results from Three Large Prospective US Cohort Studies. Am J Clin Nutr. 2023 Dec;118(6):1164-1171.

18. Greenberg JA, Geliebter A. Coffee, hunger, and peptide YY. J Am Coll Nutr. 2012 Jun;31(3):160-6.

19. Gavrieli A, Karfopoulou E, Kardatou E, Spyreli E, Fragopoulou E, Mantzoros CS, Yannakoulia M. Effect of different amounts of coffee on dietary intake and appetite of normal-weight and overweight/obese individuals. Obesity (Silver Spring). 2013 Jun;21(6):1127-32.

20. Correa M, SanMiguel N, López-Cruz L, Carratalá-Ros C, Olivares-García R, Salamone JD. Caffeine Modulates Food Intake Depending on the Context That Gives Access to Food: Comparison With Dopamine Depletion. Front Psychiatry. 2018 Sep 6;9:411.

21. Wang Z, Qiu B, Gao J, Del Coso J. Effects of Caffeine Intake on Endurance Running Performance and Time to Exhaustion: A Systematic Review and Meta-Analysis. Nutrients. 2022 Dec 28;15(1):148.

22. Guest NS, VanDusseldorp TA, Nelson MT, Grgic J, Schoenfeld BJ, Jenkins NDM, Arent SM, Antonio J, Stout JR, Trexler ET, Smith-Ryan AE, Goldstein ER, Kalman DS, Campbell BI. International society of sports nutrition position stand: caffeine and exercise performance. J Int Soc Sports Nutr. 2021 Jan 2;18(1):1.

Posted on

Popular Diets: Considerations for Athletes

The American Heart Association (AHA) recently issued a scientific statement evaluating popular diets against current recommendations for diets promoting cardiometabolic health. This review explores which diets may be better for long-term sustainability and how popular diets overlap with nutritional considerations for athletes.

Research Reviewed: Popular Dietary Patterns: Alignment With American Heart Association 2021 Dietary Guidance: A Scientific Statement From the American Heart Association

Why did the AHA prepare this statement?

Diet types have different levels of flexibility based on rules or recommendations. While flexibility is important, vague rules can also lead to misunderstandings or unintended food choices that may work counter to long-term health goals. For example, certain popular diets may fall outside of certain macronutrient distribution ranges and/or exclude major food groups. Popular media, and even some clinicians, misunderstand the evidence base of dietary patterns promoting cardiometabolic health. The goal of the statement is to compare popular diets to evidence-based AHA Dietary Guidance and provide clarity regarding the implementation of these diets.

What are the 2021 AHA Dietary Guidelines?

Refreshed every five years based on scientific reviews of available evidence, the AHA Dietary Guidelines associated with good cardiometabolic health and prevention of disease are based on ten criteria. AHA established these guidelines considering diets require flexibility based on individual, social, and cultural preferences in order to support healthy behaviors.

Popular diets AHA Guidelines

Popular diets defined and scored vs. the AHA Guidelines

The researchers conducted a review of publicly available literature regarding diet trends, including randomized control trials and descriptions from health organizations. They excluded diets designed to manage non-cardiometabolic diseases, short-term diets, and commercial diets with unclear definitions. After these exclusions, the researchers established the defining features of each remaining diet type.

Ten dietary patterns emerged based on similarities in macronutrient profiles, emphasized food groups, and restricted food groups.

Each of the diets was scored using a points system against the AHA guidelines, where a score of 1 point per guideline was given if the diet matched the guidance, 0.75 points if it mostly matched, 0.5 points if it partially matched, and 0 points if the diet was contrary. The subject matter experts discussed their scores to achieve consensus. A normalized score of 100 indicates perfect alignment.

Only criteria 2-9 were scored. Criteria 1 (maintain a healthy weight by adjusting energy intake and expenditure) is not directly attributable to a specific diet. Weight loss, maintenance, or weight gain can be achieved through any diet type by adjusting calorie energy intake. The authors note, “Low energy-dense foods such as vegetables and fruits are associated with greater satiety, and some evidence suggests that higher intakes of fiber and protein promote satiety. Energy balance may also be influenced by dietary restraint: Highly restrictive diets can support short-term energy restriction and weight loss, but have been associated with higher food cravings and attrition over time, although that may be modulated by individual characteristics. In addition, food availability and exposure to highly palatable, often ultra-processed foods may affect energy balance.”

What were the results?

DASH, Mediterranean, Pescatarian, and Ovo/Lacto Vegetarian diets had highest alignment with the AHA Guidelines.

Low-fat diets (<30% of calories from fat) and Vegan diets were mostly in alignment with the AHA Guidelines.

Very low-fat diets (<10% of calories from fat) and low carbohydrate diets (30-40% of calories from carbohydrate) had some partial alignment with the AHA guidlines.

Paleo and very-low carbohydrate diets (<10% of calories from carbohydrate) were poorly aligned with the AHA Guidelines.

DASH earned the top score. This dietary pattern was developed upon AHA recommendations.

Analysis

Considering health-promoting diet and long-term sustainability

I’ve plotted the AHA scores versus the number of food groups eliminated. Assuming no necessary dietary restrictions, the elimination of food groups or foods may make long-term adherence to a particular diet more challenging. In the short term, some find that diets with more food restrictions can be beneficial for their goals by reducing the number of daily decisions about food. However, these restrictions can be challenging to adhere to in the long term, considering the social, mental, and emotional aspects of food beyond simply “fueling the body”.

Diets that align best with the AHA Guidelines (DASH, Mediterranean, Pescatarian) also tend to have fewer food restrictions. Low fat (20-30%) and low carb (30-40%) diets also offer higher flexibility, although low-carb diets show lower alignment with AHA recommendations.

Due to the exclusion of meats, poultry, seafood, eggs/dairy, ovo/lacto vegetarians and vegan diets have more food restrictions, but still score well along AHA recommendations. Very low-fat diets are also almost necessarily vegan diets in order to achieve <10% of calories from fat, with additional elimination of nuts, oils, and seeds.

Paleo and very low-carb diets have poor alignment with heart-healthy diet guidelines and also tend to have more restrictions.

What to consider as an athlete

The AHA heart-healthy diet recommendations were created to promote good health and prevent disease at the general population level. They don’t take into account inter-individual variability within a group, nor the specific dietary needs of athletic populations.

I’ve prepared a summary of AHA alignments and areas requiring more attention by athletes. Diets scoring higher for promoting cardiometabolic health can also be strongly aligned with the needs of athletes towards performance improvement and other beneficial training adaptations.

Take Home Points

  • Not all popular dietary patterns are well aligned with diets supporting long-term cardiometabolic health.
  • Dietary patterns that support the goal of improving athletic performance can strongly overlap with dietary patterns that support cardiometabolic health. Diet patterns that are misaligned with supporting cardiometabolic health also have more potential shortcomings for athlete health and performance.
  • When choosing a diet, think about what you can stick to long-term. It may be helpful to implement a diet that enables diversity/less restrictive food choices.

Feel overwhelming? If you need help navigating the nutritional landscape for your specific athletic needs, please contact me.

Posted on

Egg and Egg White Nutrition

Hard Boiled Eggs
Egg and Egg White

Is it healthy to eat whole eggs? Are egg whites a better option? Here, we review egg and egg white nutrition and highlight the latest research.


Egg and Egg White Nutrition: Macronutrients, Vitamins, and Minerals

EGG MACRONUTRIENTS

By weight, whole eggs are mostly water! Considering only the solids, a large egg provides 6 g of protein and 5 g of fat, with minimal amount of carbohydrate. Most of the protein is in the white (4 of 6 grams), and all the fat is in the yolk (5 of 5 grams).

Vitamin Content of Eggs

With the exception of vitamin C, eggs are vitamin rich. The highest nutrient density is in the yolks. As expected, the vitamins that are fat-soluble (A,D,E,K) are exclusively found in the yolks since there’s no fat in egg whites. Eggs are also relatively high in phosphorous, calcium, and potassium.[1]

Egg and Egg White Nutrition: Micronutrients

Choline

Beyond vitamins and minerals, eggs are a good source of choline. This essential nutrient is a structural element of our body’s cell membranes and a precursor molecule for acetylcholine. Think of acetylcholine as the CEO neurotransmitter in the parasympathetic nervous system, communicating signals for muscle control, blood vessel dilation, and regulation of heart rate. Choline also plays a role in memory, mood, and other brain and nervous system functions. Although our bodies can make small quantities of choline, most of it must be consumed through diet. One egg contains 147 mg choline and the US Recommended Nutrient Intake (RNI) for healthy adults is 425 mg/day for females 550 mg/day for males.[2] If you aren’t an egg eater, other lean protein sources of choline are beef top round (117 mg in 3 oz) and soybeans (107 mg in 1/2 cup).

Carotenoids

Egg yolk is a highly bioavailable source of plant pigment carotenoids lutein and zeaxanthin (on average 292 and 213 micrograms/yolk, respectively). These pigments also provide the yolk its yellow color. Hue will depend on what the hen is eating. Chicken farmers sometimes will add other natural pigments such as beta-carotene and marigold to chicken feed to make yolks darker.

Lutein and zeaxanthin accumulate in the retina. Multiple observational and interventional trials indicate lutein has beneficial impact on diseases of the eye,[3] preventing or even improving both age-related macular degeneration (AMD), the leading cause of blindness and vision impairment. Lutein may also have positive effects towards other conditions, research results have been equivocal for total favorable effects on human health and there is no recommended dosage. As an alternative, it’s possible to supplement lutein or consume it from plant-based foods – for example kale, spinach, or broccoli. Bioavailability from plant sources may be reduced,[4,5,6] but this may also depend on co-consumed foods.


Green Eggs

You may have noticed yolks take on a green hue when they’ve been sitting around for a bit or are overcooked. Totally normal and safe. It’s iron sulfide – a reaction between the iron in the yolk with hydrogen sulfide gas generated from the egg protein during cooking. Hydrogen sulfide is also responsible for the stink….


Are Whole Eggs “Bad”? – Eggs and CVD Risk

Historically, consumption of high cholesterol foods was directly implicated in increased risk of of cardiovascular disease (CVD). Pre-2013, the American Heart Association/American College of Cardiology Dietary Guidelines for Americans recommended limiting dietary cholesterol to <300mg/day. For reference, one egg contains ~187mg of cholesterol.

More recent revision of guidelines did not again bring forward this recommendation. Available evidence shows no appreciable relationship between consumption of dietary cholesterol and serum cholesterol. The available evidence suggests that within the context of actual dietary patterns, replacing foods high in saturated fat (which typically also contain more cholesterol) with foods higher in polyunsaturated fats (PUFAs) are expected to produce greater reductions in LDL cholesterol than reducing dietary cholesterol intake alone. Therefore, cholesterol specifically is not a nutrient of concern for overconsumption.[7,8,9]

In this context, eggs are an outlier as they are high in cholesterol yet low in saturated fat. In the most recent prospective cohort study,[10] moderate egg consumption (1 egg/day) is not associated with overall cardiovascular disease risk. If dietary cholesterol is a concern, evidence supports reduction in consumption of ultra-processed meats and fried foods, combined with addition of more dietary fiber from vegetables and fruits as more beneficial action than elimination of egg yolks.

Of course, the danger in study interpretation in support of, or against whole egg consumption is generalization over large populations, which may not be relevant at the individual level. If you have specific concerns, consult your physician.


Egg Protein – Strength and Body Composition

Eggs are a high-quality protein source, providing all essential amino acids (EAAs). They’re also highly digestible, achieving a top score of 1 per Protein Digestibility Corrected Amino Acid Scoring (PDCAAS). With respect to total essential amino acid (EAA) concentration, egg protein is comparable to human skeletal muscle.[11]

EAA Content in Different Protein Sources

Is there a “winner” in terms of eating whole eggs versus egg whites? Depends on your goals, but if you’re a resistance training individual pursuing strength gains, whole eggs *may* provide a slight advantage.

Although dietary amino acid availability is a major correlate to post-exercise muscle protein synthesis (MPS), research conducted by Sawan [12] and van Vliet [13] highlights that there are impactful non-protein variables that impact MPS anabolic signaling. The observed MPS response with whole egg consumption versus protein-equated egg white consumption indicates compounds in the yolk have a synergistic effect. Although a 2020 study [14] indicated egg whites and whole eggs similarly support muscle hypertrophy provided total protein intake is maintained, more recent research by Bagheri [15] found that their whole egg eating test subjects demonstrated increased quadriceps and handgrip strength and a reduction in body fat % compared to their protein equated egg-white eating group.

If strength is your goal, there’s no need to avoid eating whole eggs and sticking only to whites. Provided you have enough total protein in your diet, whole eggs appear to be just as beneficial (if not more beneficial) to your progress. If your primary goal is weight loss, the primary factor to consider is maintaining a calorie deficit. Egg whites contribute calories from protein, whereas whole eggs contribute calories from protein plus more energy-dense fats. Limiting the amount of egg yolks can help keep total calories and fat macros in check.


Quick Egg Recipes and Egg Substitutes

Although freshly cooked eggs usually taste the best, it’s no issue to store cooked eggs in the fridge for a week. They can readily be reheated in the microwave. Here are a few ideas for meal prep or quick cooking:

Many baking recipes require eggs, which is a bit trickier if you’re vegan. Here are a few alternatives with the macronutrient comparison:

kcalProteinCarbsFats
1 Whole Egg786.00.65.0
EQUIVALENT to 1 EGG IN BAKING:    
1/4 cup unsweetened applesauce250.07.00.0
1 tbsp. soy protein + 3 tbsp. water204.30.00.3
1 tbsp. ground flax seed + 3 tbsp. water401.52.03.0
2 tbsp. ground chia seed + 3 tbsp. water301.02.51.0

I hope you found this review of egg and egg white nutrition valuable! Reach out anytime if you have questions.

Ready to focus on your performance and body composition? Contact me to discuss nutrition coaching.


[1] Rehault-Godbert, S.; Guyot, N.; Nys, T., The golden egg: nutrition value, bioactivities, and emerging benefits for human health, Nutrients, 11, 684, (2019).

[2] Institute of Medicine, Food and Nutrition Board. Dietary Reference Intakes: Thiamin, Riboflavin, Niacin, Vitamin B6, Folate, Vitamin B12, Pantothenic Acid, Biotin, and Choline. Washington, DC: National Academy Press; 199

[3] Buscemi, S.; Corleo, D.; et al., The effect of lutein on eye and extra-eye health, Nutrients, 10(9), 1321, (2018).

[4] Handelman, G.J.; Nightingale, Z.D.; et al., Lutein and zeaxanthin concentrations in plasma after dietary supplementation with egg yolk, Am J Clin Nutr., 70(2), 247, (1999).

[5] Chung, H-Y.; Rasmussen, H.M.; Johnson, E.J., Lutein bioavailability is higher from lutein-enriched eggs than from supplements and spinach in men, J Nutr., 134(8), 1887, (2004).

[6] Eisenhauer, B.; Natoli, S.; et al., Lutein and Zeaxanthin-Food Sources, Bioavailability and Dietary Variety in Age-Related Macular Degeneration Protection, Nutrients, 9(2), 120, (2017)

[7] Eckel R.H.; Jakicic, J.M.; et. al., 2013 AHA/ACC guideline on lifestyle management to reduce cardiovascular risk: a report of the American College of Cardiology/American Heart Association Task Force on Practice Guidelines [published corrections appear in Circulation. 2014;129:S100–S101 and Circulation. 2015;131:e326]. Circulation. 2014; 129 (suppl 2):S76–S99. doi: 10.1161/01.cir.0000437740.48606.d1

[8] Carson, J.S.; Lichtenstein, A.H.; et al., Dietary Cholesterol and Cardiovascular Risk: A Science Advisory From the American Heart Association, Circulation, 141(3), 2019.

[9] Mensink R., Effects of saturated fatty acids on serum lipids and lipoproteins: a systematic review and regression analysis. Geneva, Switzerland: World Health Organization; 2016.

[10] Drouin-Chartier, J-p.; Chen, S.; et. al., Egg consumption and risk of cardiovascular disease: three large prospective US cohort studies, systematic review, and updated meta-analysis, BMJ, 4(368), 513, (2020).

[11] van Vliet, S.; Burd, N.; van Loon, L.J.C., The skeletal muscle anabolic response to plant- versus animal-based protein consumption, J Nutr., 145(9), (2015)

[12] Sawan, S.A.; van Vliet, S.; et. al., Whole egg, but not egg white, ingestion induces mTOR colocalization with the lysosome after resistance exercise, Am J Physiol Cell Physiol., 315(4), C537, (2018).

[13] van Vliet, S.; Shy, E.L.; et al., Consumption of whole eggs promotes greater stimulation of postexercise muscle protein synthesis than consumption of isonitrogenous amounts of egg whites in young men, Am J Clin Nutr., 106(6), 1401, (2017).

[14] Bagheri, R.; Moghadam, B; et.al., Comparison of whole egg v. egg white ingestion during 12 weeks of resistance training on skeletal muscle regulatory markers in resistance-trained men, British Journal of Nutrition, 124(10), 1035, (2020).

[15] Bagheri, R.; Hooshmand, M.; et. al., Whole egg vs. egg white ingestion during 12 weeks of resistance training in trained young males: A Randomized Controlled Trial, J Strength Cond Res., 35(2), 411, (2021).

Posted on

Breaking a Fat Loss Plateau

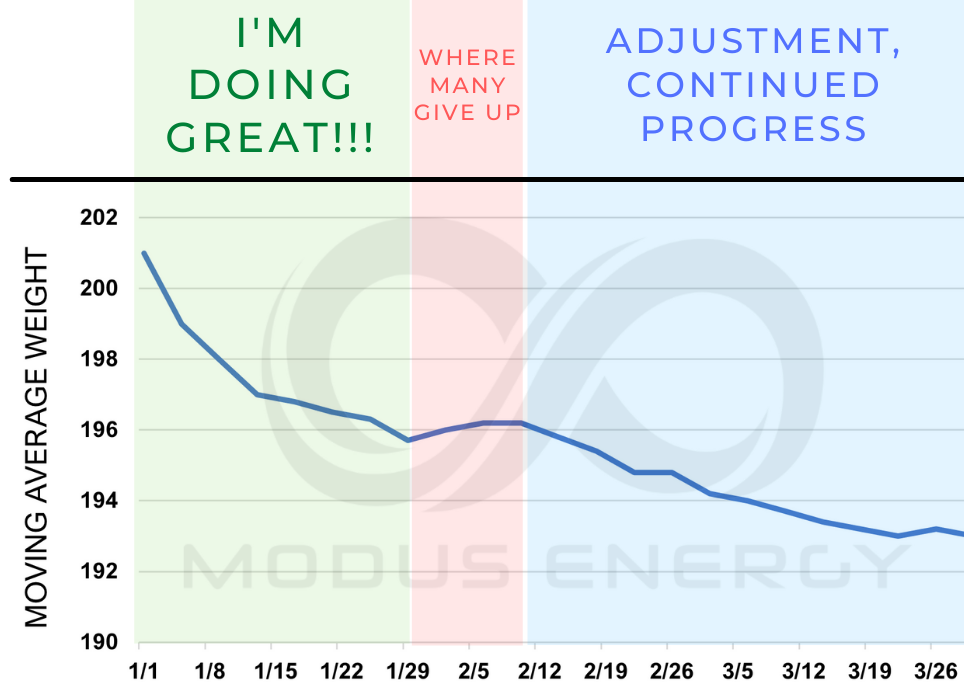
It’s frustrating to be consistent with nutrition, make amazing weight loss progress, but then for no reason hit a wall. Many give up when the scale stops moving. A fat loss plateau is disheartening.

You may be a bit relieved to hear that you’re not alone. A fat loss plateau – two or more weeks where the scale doesn’t move – is almost EXPECTED during a dieting phase. The good news is there are fundamental reasons why it happens, and there are methods to break through.

Need a plan and support to improve your physique, strength and energy? Contact me to explore options.

Why We Plateau

Human metabolism is dynamic and adaptive to changes in energy intake. Total daily energy expenditure (TDEE) aka “calories out” decreases in response to a sustained reduction in calorie intake. Two adaptations are primarily responsible:

  • Reduction in basal metabolic rate (BMR). BMR is the energy we expend to breathe, move blood through our bodies, maintain organ function…basically to keep us alive. In a sustained calorie deficit, BMR slows down as we lose weight – the body is adapting to the calorie deficit. You don’t have much control over BMR.
  • Reduction in non-exercise activity thermogenesis (NEAT).  Whether you are aware of it or not, in a sustained calorie deficit you will expend less energy throughout the day – sitting for a bit longer than normal, less fidgeting, etc.

The body is driven to maintain balance. Therefore, when we place our bodies in an energy deficit through consumption of fewer calories (energy in < energy out), there are regulatory drivers that act to restore neutrality. For example, reductions in energy intake influences the rate of release of certain hormones. Ghrelin hormone is upregulated in an energy deficit, promoting increased feelings of hunger. Satiety hormone leptin is downregulated (due to shrinking size of fat cells and fatty acid mobilization). Further, “stress” hormone cortisol increases which can lead to reduced energy expenditure, and insulin sensitivity of fat cells increases (easier to assimilate glucose and store fat).

Calories in and calories out are not independent variables – they are influenced by one another. Energy intake level impacts energy expenditure level. Fat loss is not just a matter of calorie counting, NOR can we simply blame our hormones.

As you diet and lose weight, what was once calorie deficit becomes maintenance calorie level through metabolic adaptation. Therefore, it’s expected at some point there would be a fat loss plateau. To again achieve an energy deficit, energy intake and expenditure require adjustment.

We also need to consider that downward scale movement may not be the best indicator of fat loss. If you have recently initiated resistance training, are noticing your measurements change and/or you look different in photos, you may be building muscle while losing fat. In this case, the scale is not directly providing fat loss feedback.

Overcoming the Fat Loss Plateau

Before considering adjustments, perform an audit of current dietary compliance. There’s no need to reduce nutrients if energy intake is actually higher than the calories you are accounting for.

Dietary Compliance Audit

  • “Extras”.  Assess use of condiments and sauces – these can add 100’s of calories per day.
  • Nibbles. Are you doing fly-bys of the fridge, and “just” having bites? It’s easy to lose sight of these unaccounted-for bites, but this accumulation of small amounts of additional calories throughout the day may take you out of a calorie deficit. Utilize mindfulness – all food consumed on a plate sitting down, with minimal distraction. Personally, I’m still working on this habit!
  • Variability in dining out portions. Restaurant portion size and nutrition information is not tightly controlled. It may vary significantly depending on who is preparing your food. If you are eating out frequently and the cook is regularly overserving on portions, this could also be adding 100’s of additional calories per day or week
  • Tracker inputs. Food entries in programs such as MyFitnessPal are user-generated, and potentially have errors. To be safe, double check your inputs against the nutrition information on the products you use. The USDA database is also an excellent source of nutrition information.
  • Food Measurement – there’s a tradeoff between accuracy and practicality in “eyeballing” portions, using measuring cups (volume), and weighing food. If you feel that your portions may be off, consider weighing food for a period to make sure portions are accurate.

If the scale hasn’t budged for about 2 weeks and you’ve passed your audit, it’s time to consider adjusting your plan. We don’t want to do anything extreme or non-sustainable. Rather, make small changes to energy intake and expenditure.

Adjusting Energy Intake and Expenditure

  • Small reduction in energy intake: reduce your calories in small steps versus large jumps  – 50 to 100 calories/day is a good place to start. Wait a week or so between each step before deciding on further adjustment. You may find that in order to reduce calories it will require swapping out some higher calorie density foods for lower calorie dense foods to feel full.
  • Increase daily movement (increase NEAT): it’s not sustainable to continually increase exercise to offset metabolic adaptation. You can’t out-exercise your diet. Rather, consider a few easy NEAT habits! Assuming you are sleeping 8h per day and training 1 hour per day, that leaves more than 60% of your waking hours to get in a bit more movement! Some examples of NEAT are walking when you’re talking on the phone, parking further away while out shopping, going for a dog walk, cleaning the house, and of course doing a quick happy dance for no reason. You may find that this extra movement helps your mood and overall energy stability throughout the day as well.

Final Thoughts on the Fat Loss Plateau

If you are experiencing significant fatigue and stress, gym performance has crashed, have negative changes in sleeping, or are noticing unhealthy feelings about food, a plateau may be a sign to take a break. By shifting into maintenance, you’ll provide yourself with breathing room to enjoy more flexible eating. This has physical and psychological benefit. It’s perfectly acceptable to hit the pause button on fat loss and focus on stability. Likewise, if you’ve been dieting strictly for an extended period of time, consider taking a couple of months in energy maintenance before proceeding with further fat loss.

Posted on

Chicken Veggie Pot Pie Soup

Chicken Veggie Pot Pie Soup

A warm and satisfying chicken veggie pot pie soup loaded with veggies and classic spices. Heaped with protein and micronutrients!

I absolutely love the flavors in pot pie, so created this healthier soup version loaded with veggies.

To add more color to the soup, I used Trader Joe’s “Carrots of Many Colors” and English peas. Increasing the colors in your diet with a variety of vegetables (and fruits) provides a broader spectrum of plant phytopigments. Many of these compounds (e.g. the polyphenol anthocyanin found in purple carrots), have antioxidant properties.

For the soup base, I used low-sodium chicken broth plus collagen protein as a thickener. Alternatively, you could use chicken (or turkey) stock and omit the collagen. Or, if you want to make a plant-based soup, omit the chicken or turkey and use vegetable broth, and instead add an additional 2 tbsp flour to the base.

Homogenizing the riced cauliflower, broth, collagen, oil, and flour with an immersion blender or in a high speed blender provides the soup a creamier tasting base without the need to add butter. I’m not into having a lot of kitchen gadgets, but if you make a lot of soup or stews an immersion blender is super handy.

Ward off the cold with this warming and satisfying pot-pie soup. It’s rich tasting and loaded with flavorful veggies!

Need to rehab your nutrition? Schedule a call with me to review your current eating and how to best achieve your goals.

Disclosure: as an amazon associate I earn from qualifying purchases. This supports keeping the website ad and pop-up free.

Posted on

Chocolate Cranberry Bran Muffins

Chocolate Cranberry Bran Muffins

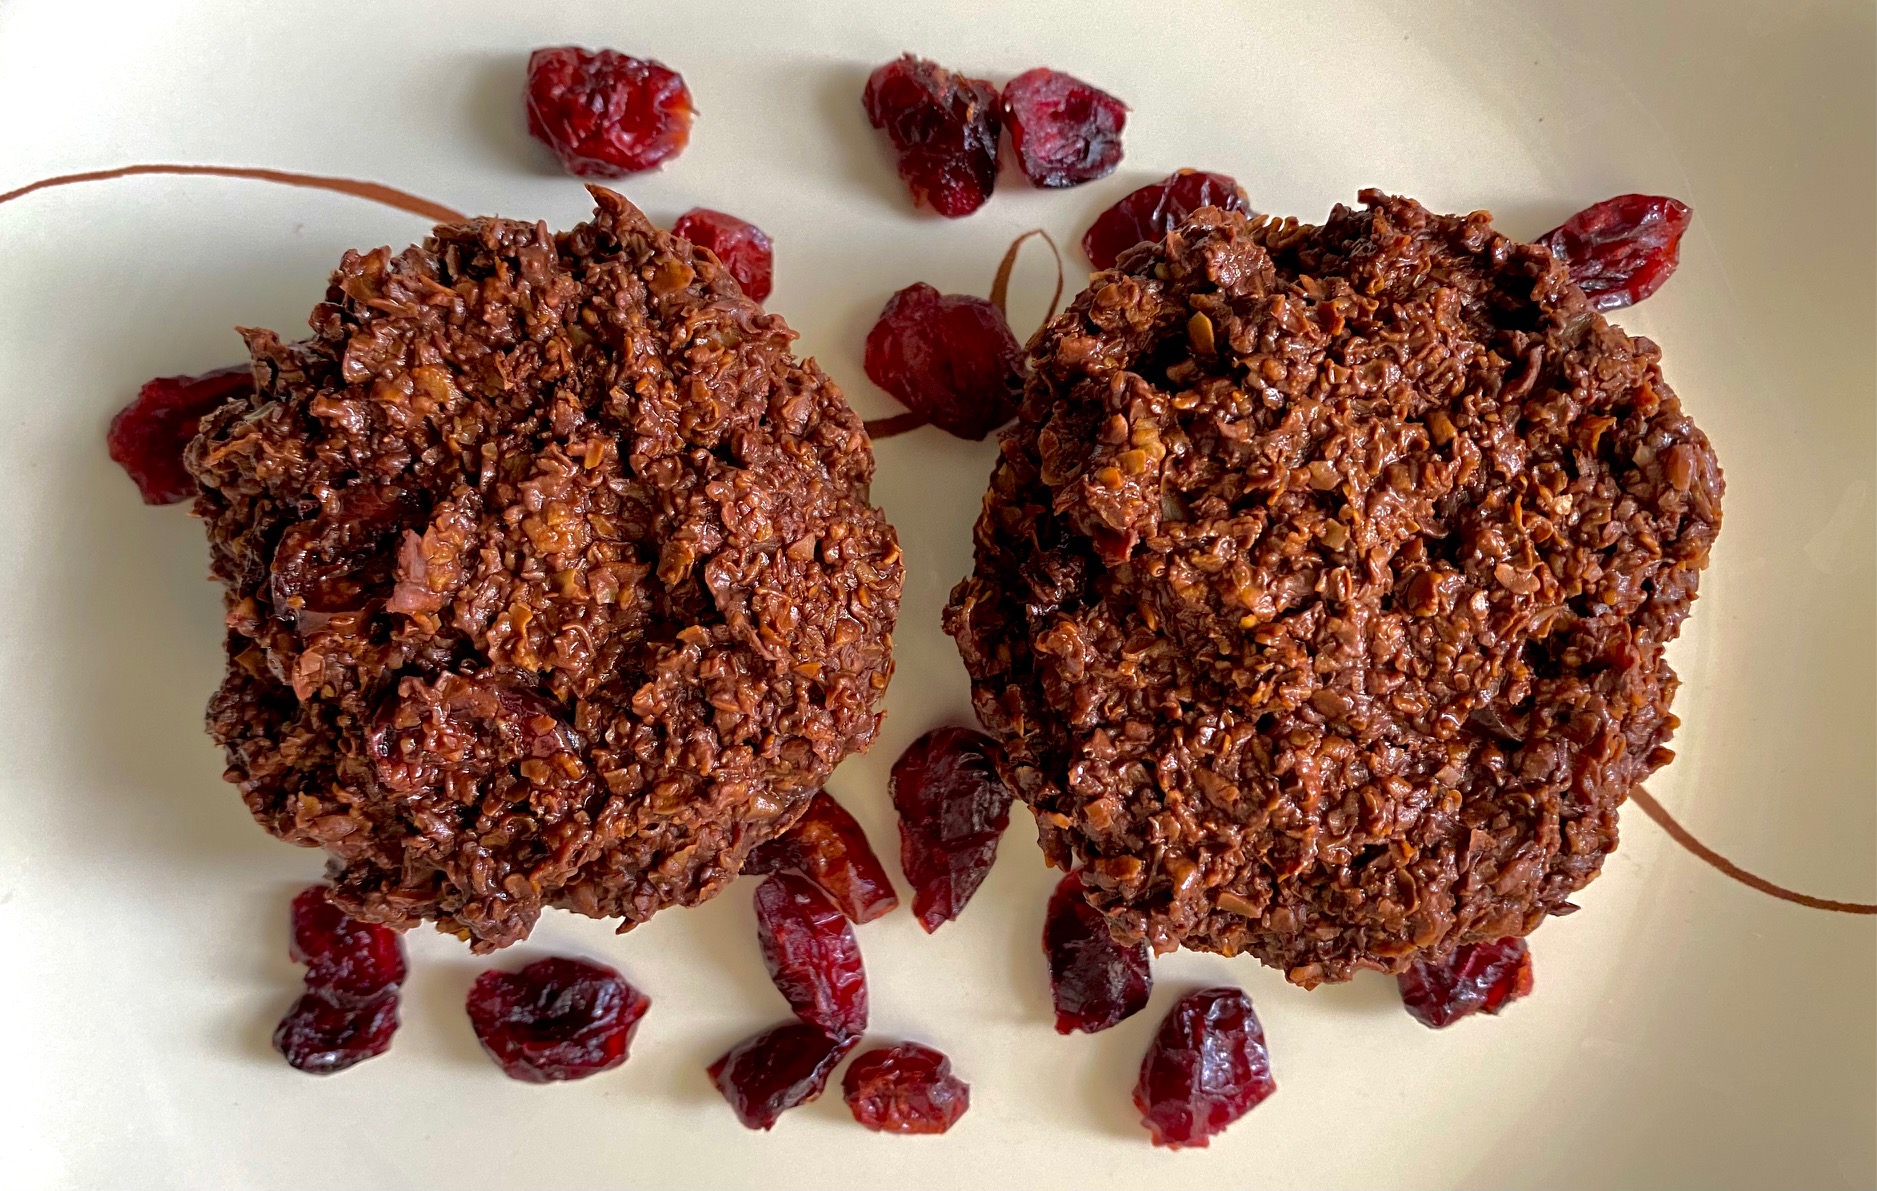
These delicious chocolate cranberry bran muffins are packed with healthful fiber and micronutrients. The words “fiber” and “delicious” are not often used in the same sentencethanks to cacao, molasses, and oat bran, it’s possible! About 115 Calories and 5g of fiber in each muffin.

I like bran muffins, but don’t like the bloaty feeling as if I’ve eaten an entire wicker swing set. These are perfectly portioned at 115 Calories each and contain 5g of fiber per muffin. Enough to do some good, but not enough to cause…ahem…unexpected surprises.

Each muffin has 5 g of sugar which comes from the no-sugar added dried cranberries and molasses. Molasses is a necessary ingredient in bran muffins for the classic taste, but we’ve used less than in a typical recipe and supplemented with no sugar pancake syrup.

These chocolate cranberry bran muffins do not contain oil or added fat. Strategic use of riced cauliflower makes them moist but adds no taste. Many of my clients struggle with vegetable intake – there are plenty of ways to incorporate them into your diet to make them easier to eat.

Be sure to let them cool completely before placing in a Tupperware in the fridge. They still taste excellent after re-heating in the microwave for a few seconds. I recommend topping with Greek yogurt or some almond butter.

A delicious and rich chocolatey treat with beneficial fiber and micronutrients. 113 calories with 5g of fiber per muffin

Looking for a balanced nutrition strategy to meet your goals? Contact me for a free consultation.

Disclosure: as an amazon associate I earn from qualifying purchases. This supports keeping the website ad and pop-up free.

Posted on

Short Sleep and Weight Gain

Short Sleep and Weight Gain
Impact of Sleep Loss

We’ve all felt how short sleep can impair our ability to think, feel, and perform our best. A night of bad sleep happens from time to time – lethargy, fogginess, and/or irritability are all but impossible to shake. Fortunately, with a good night of sleep we’re usually as good as new.

In contrast, chronic shortened sleep presents more insidious issues. One out of every three adults in the US gets less than the recommended 7 hours per night.[1] Further, per the National Sleep Foundation, 35% of polled individuals report sleep quality as “poor” or “only fair”.[2]

Drivers of Short Sleep and Weight/Fat Gain

Data demonstrates a linkage between shortened sleep and increased risk of developing obesity, diabetes, heart disease, stroke, and mental distress. Decreased sleep duration and quality is associated with increased body weight and body fat. Epidemiological evidence supports the role of inadequate sleep contributing to the high prevalence of obesity (in children and adults).

The drivers behind short sleep and weight gain, increased fat mass, and potential loss of muscle/lean mass are highly interconnected.

Short Sleep and Weight Gain

1. Increased hunger and reduced satiety

Sleep, food, activity, and stress directs our body to release or throttle back certain hormones. In turn, these hormonal signals can influence our behaviors. Leptin and ghrelin are two hormones that contribute to our regulation of food intake. Leptin aka the “satiety hormone” is released by our fat cells and communicates our energy status to the brain. Levels increase as we eat and become full – telling the central command center “all good – we have energy”. Generally, leptin levels are lowest in the morning and build throughout the day as we consume food. They peak into the evening. Lower leptin levels are associated with decreased satiety from food and drive to increase energy intake. Ghrelin, a.k.a. the “hunger hormone”, is released by stomach cells to stimulate our appetite. Levels rise when are hungry, and fall when we are full.

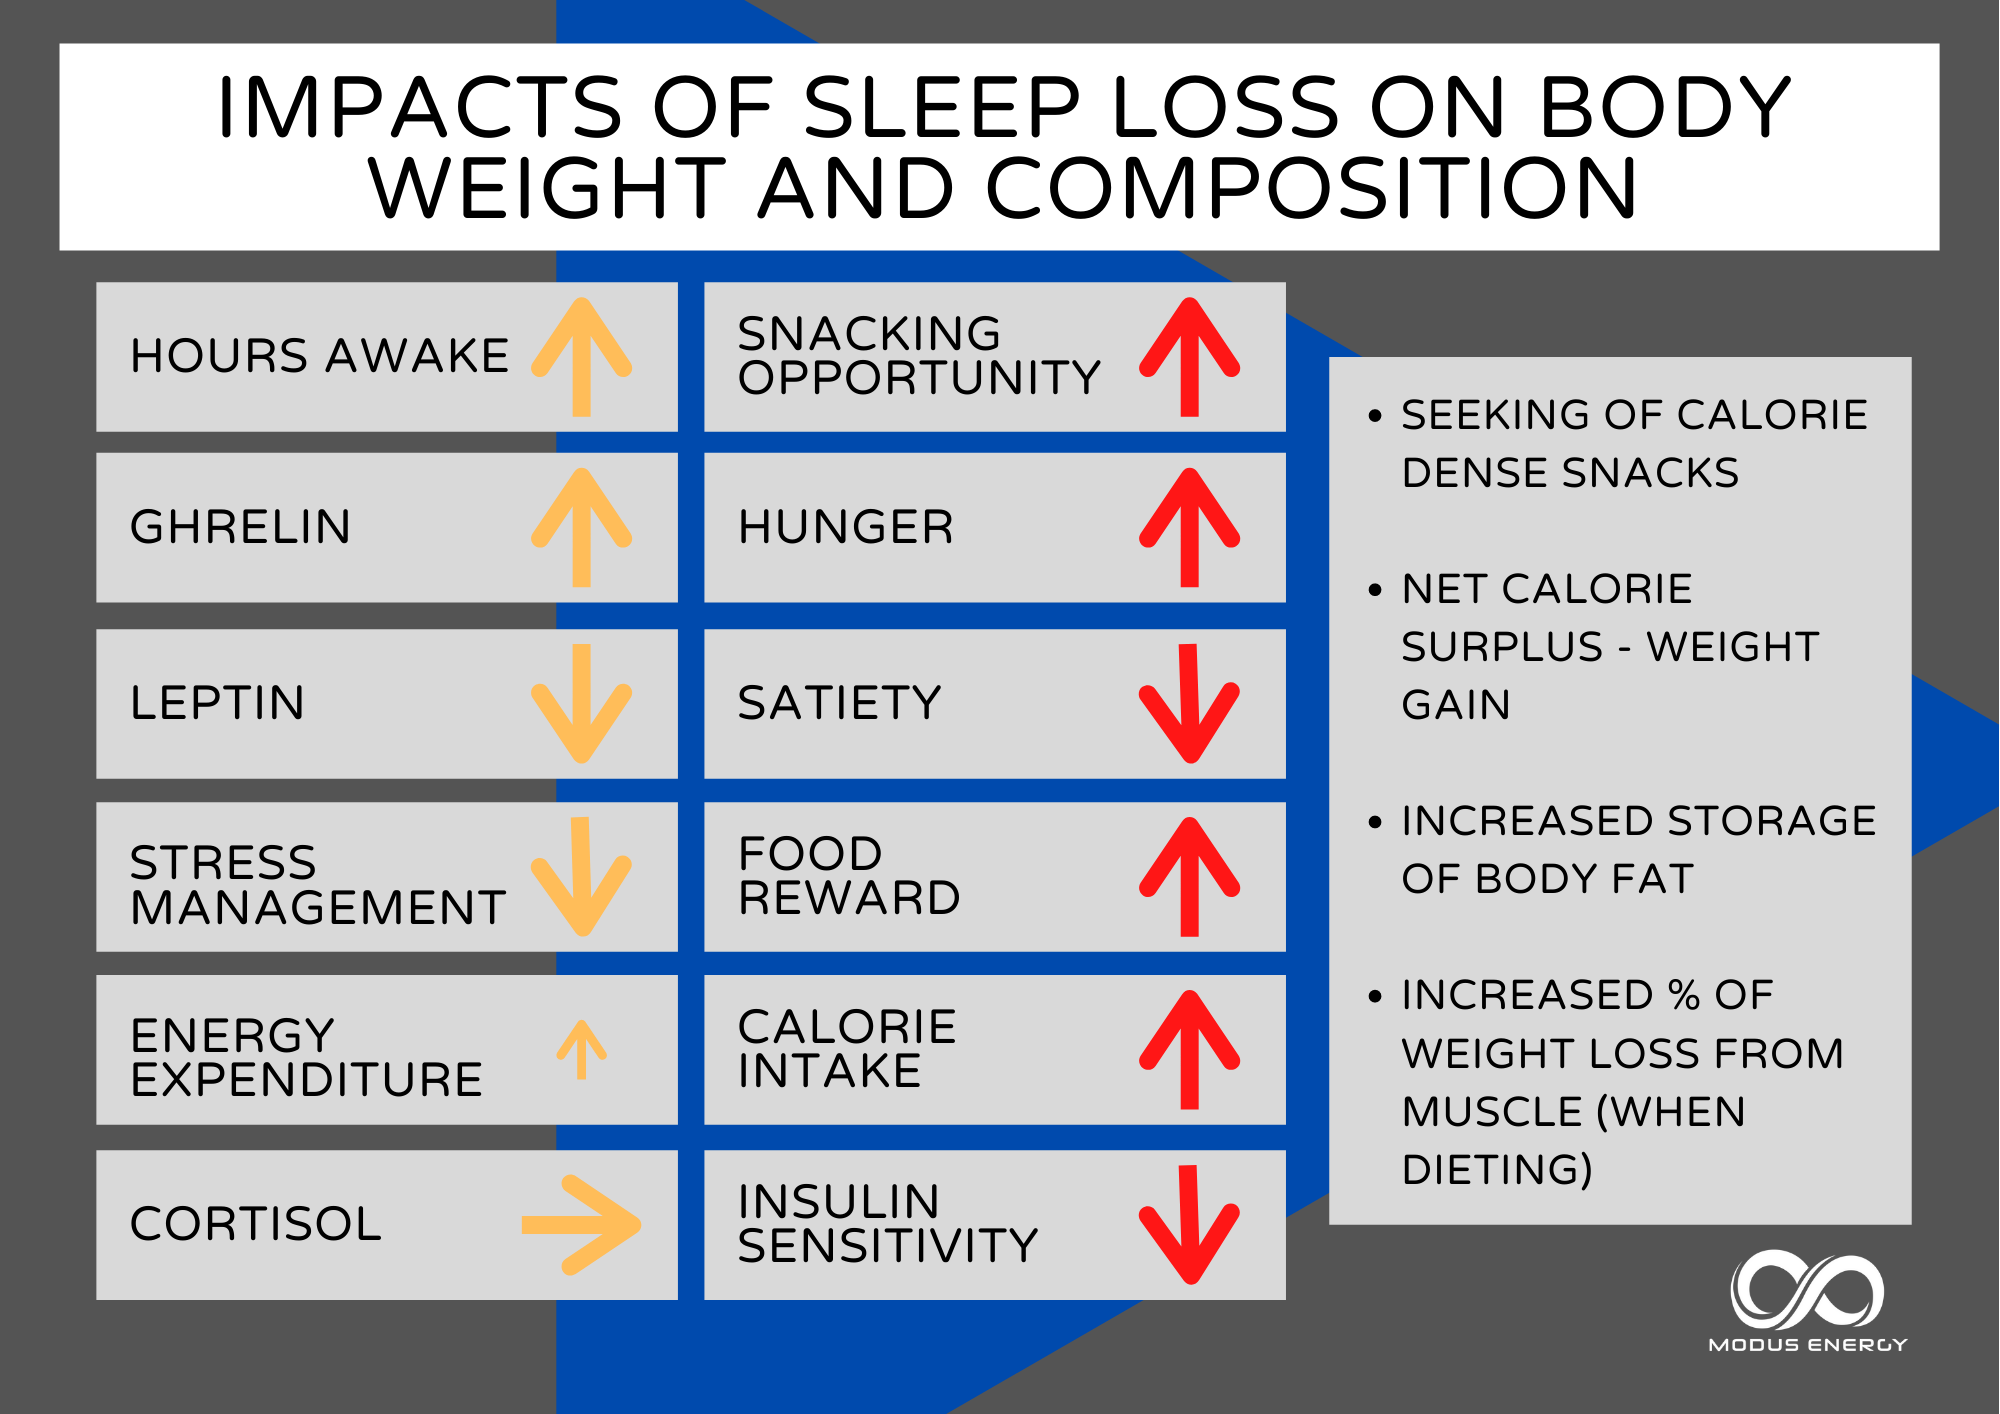
Depending on the nature of sleep debt, leptin levels may fall and ghrelin levels may rise. Our bodies are signaling our brain for extra calories, and those calories are likely coming from additional fat and/or carbohydrates.

A randomized crossover study examined appetite regulation after 2 nights of 4 h in bed and after 2 nights of 10 h in bed. Leptin levels decreased by 18% after the short nights relative to the long nights in bed. Ghrelin increased by 28% increase after the short nights relative to the long nights. Participants filled out questionnaires on hunger and appetite, indicating a 24% increase in hunger and a 23% increase in global appetite after the 4-hour nights versus the 10-hour nights. Appetite for high carbohydrate nutrients was the most affected with a 32% increase.[3]

Another study demonstrated a correlation between shortened sleep and increased energy intake, and particularly fat intake.[4] In a group of middle-aged men and women, the study controlled dietary intake for 3 days, followed by 2 days of free eating during 5 nights of 4 h time in bed compared with 9 h time in bed. Energy intake increased by about 300 kcal/day in the 4h sleep condition, with notable increase in dietary fat intake, suggesting a preference toward high fat foods under conditions of sleep deprivation.

Catch-up sleep does not appear to be an effective strategy. We don’t re-set our calorie intake back to baseline levels even if we can get multiple nights of extended sleep.  

In an 18 day laboratory study,  participants were placed in a varying sleep-restricted/recovery group (varying numbers of sleep restricted days (4 h of time in bed) and recovery days (12 h time in bed) or a control group (allowed 10 h time in bed every night). Regardless of the ratio of sleep restricted to recovery days, all participants that had some days of sleep restriction had increased daily intake, on average, in excess of 500 kcal/day versus the control group.[5] In short, weekend catch up sleep is unlikely to lead to reduced calorie intake if intake levels were elevated during short sleep periods.

2. More hours awake + access to tasty food + increased reward response = increased calorie intake (likely from extra snacking)

Although it may seem obvious, reduced sleep means that there are more waking hours available to eat.

One study conducted over 14 days compared a group of men and women who either had 8.5 or 5.5 h time in bed, with both groups able to freely eat meals and snack foods as they desired. During the 5.5 h condition, participants consumed significantly more snacks after dinner (with no change in meal intake between groups), and chose snacks were higher in carbohydrate content.[6]

Considering some studies report no significant changes in ghrelin and leptin levels with reduced sleep, hedonic factors may contribute to increased weight gain and adiposity. The impact of short sleep duration on stress response and reward-seeking behavior can be powerful, and stronger in certain individuals than in others.

A key region in the brain frontal cortex plays a strong role in our perception of representations of food. Higher activation of this brain region has been found in obese compared with normal-weight test subjects when anticipating food[7] indicating that the reward we get from food is enhanced in obesity.

A similar response is found in normal-weight individuals after one night of total sleep deprivation, indicating prolonged wakefulness leads to greater reward response in anticipation of food.  Sleep deprivation is also associated with lower scores in stress management skills which may tie directly to increased consumption of palatable foods. Specifically, reduced impulse control and difficulty to delay gratification.

3. Energy mismatch problem: increased calorie intake is higher than additional energy expenditure in shortened sleep

Chronic partial sleep deprivation leads to feelings of fatigue and slowness,[8] so you may expect that total daily energy expenditure (TDEE) decreases with less sleep. However, TDEE is slightly higher with shortened sleep.

Findings show that, compared to 8h per night baseline sleep, energy expenditure increased by ∼7% during the first 24h of sleep deprivation, and then decreased by 5% upon resumption of normal sleep. During the night, energy expenditure increased by ∼32% during sleep deprivation, and then decreased approximately 4% during recovery sleep.[9]  

The reality is that although we are expending more energy by sleeping less, this increase is small. Missing one complete night of sleep provides an additional “burn” of about 130 Calories, and this would be far less for shortened sleep versus total sleep loss. If we are snacking an additional 300-500 Calories in excess due to prolonged wakefulness coupled with only needing minimal additional calories, it’s easy to see how the calorie surplus adds up day after day resulting in fat accrual.

4. Higher % weight gain from fat (or loss of less fat when dieting)

Increased levels of evening cortisol and reduced growth hormone secretion may prompt the body to store more fat at the expense of muscle and other tissues for energy during shortened sleep.

Cortisol, our “stress response” hormone is controlled by circadian rhythmicity. The 24-hour profile of cortisol is characterized by an early morning maximum, declining levels throughout the daytime, a period of minimal levels in the evening and first part of the night, and an sharp circadian rise in later part of the night.  With shortened sleep, the body maintains higher levels of cortisol later in the day, at a point where we should we winding down and readying ourselves for sleep. Even two nights of sleep restriction (4 h compared with 10 h in bed) in normal or moderately overweight men was associated with a 21% evening cortisol elevation. Heightened cortisol makes our body tissues less sensitive to insulin[10] prompting the body to store more fat and utilize other fuel sources (muscle!) for energy. It is established that those on a diet will lose less fat and more muscle as a percent of total weight lost when sleep is restricted. [11]

I hope this summary provided you some insights on the importance of sleep! In addition to nutrition, sleep is an area we examine closely in 1:1 coaching. There are a number of tactical tools we implement to ensure you are maximizing your results. We endeavor to give you as much energy as possible and mitigate the risk of fat gain and muscle loss.

A few ideas to help with sleep:

– Enable “night mode” on your phone to reduce blue light exposure. Set the timing from sunset to sunrise. If you are watching TV or on a laptop, consider wearing blue blocker glasses.

– Cease consuming food ~2h before bed (unless you have circumstances that require later eating).

– Solidify a nighttime calming ritual, starting about 1h before bed. For example – electronics off, brush teeth, breathing exercises, reading a book.


[1] https://www.cdc.gov/sleep/data_statistics.html

[2] Knutson, K.L; Phelan, J.; et al., The National Sleep Foundation’s Sleep Health Index, Sleep Health, 3(4), 234, 2017.

[3] Spiegel K., Sleep curtailment in healthy young men is associated with decreased leptin levels, elevated ghrelin levels and increased hunger and appetite. Ann Intern Med. 141, 846–850, 2004.

[4] St-Onge M-P, Roberts AL, Chen J, et al., Short sleep duration increases energy intakes but does not change energy expenditure in normal weight individuals. Am J Clin Nutr. 94(2), 410-416, 2011.

[5] Spaeth, A.M.; Goel, N.; et al., Caloric and Macronutrient Intake and Meal Timing Responses to Repeated Sleep Restriction Exposures Separated by Varying Intervening Recovery Nights in Healthy Adults, Nutrients, 12, 2694, 2020.

[6] Nedeltcheva A.V.; Kilkus, J.M.; et al., Sleep curtailment is accompanied by increased intake of calories from snacks. Am J Clin Nutr., 89(1), 126-133, 2009.

[7] Martin L.E.; Holsen, L.M.; et al.,  Neural mechanisms associated with food motivation in obese and healthy weight adults. Obesity (Silver Spring), 18, 254 –260, 2010.

[8] Dinges D.F.; Pack, F.; et al., Cumulative sleepiness, mood disturbance, and psychomotor vigilance performance decrements during a week of sleep restricted to 4–5 hours per night. Sleep, 20, 267–77, 1997.

[9] Jung, C.M.; Melanson, E.L.; et al., Energy expenditure during sleep, sleep deprivation and sleep following sleep deprivation in adult humans., J Physiol.,589 (Pt 1), 235-244, 2011.

[10] Donga, E.; van Dijk, M.; et al., A single night of partial sleep deprivation induces insulin resistance in multiple metabolic pathways in healthy subjects., J Clin Endocrinol Metab., 95(6), 2963-2968, 2010.

[11] Nedeltcheva, A.V.; Kilkus, JM.; et al., Insufficient sleep undermines dietary efforts to reduce adiposity, Ann Intern Med., 153(7),  435–441, 2010.

Posted on

Unwrapping Nutrition Labels

Nutrition Labels

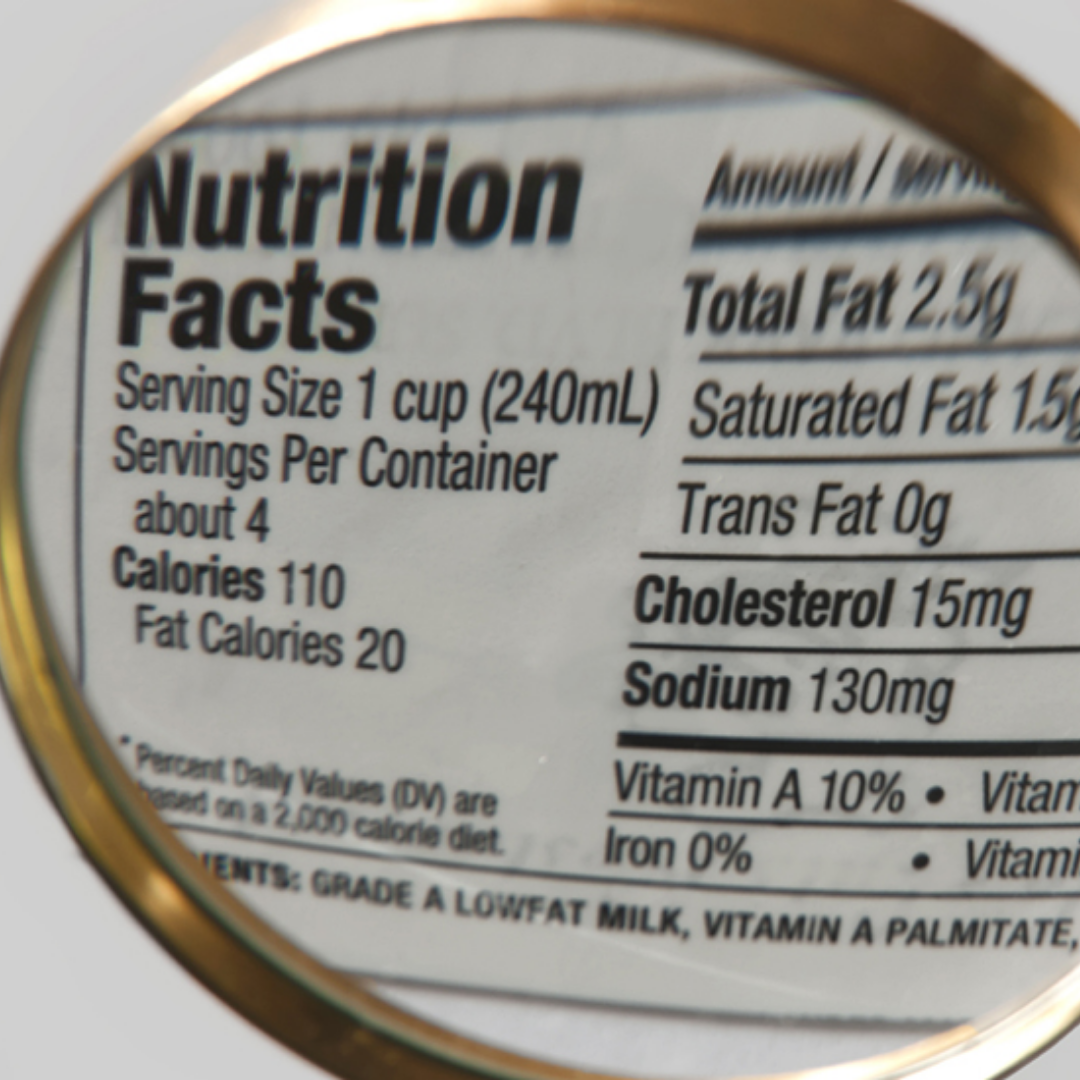
What we see and believe from reading food labels affects what we buy. Unwrapping nutrition labels can be difficult. Here are a few things you probably don’t know about the Nutrition Facts label.

Food manufacturing companies grow revenue and profit when they can effectively address evolving customer desires and deliver additional real (or perceived) value. Increasing demand for convenience food is driving significant innovation across the industry in an effort to drive growth and meet customer expectations. Products frequently target specific customer segments looking for certain food characteristics, e.g. “low-carb”, “natural”, “keto-friendly”, and “plant-based”. You’ve likely seen the increasing number of protein and nutrition bar options, cereals, crackers/chips, spreads, and other on-the-go foods being marketed to you for health, weight management, performance, or some other factor.

To help consumers to compare nutritional value between products, nutrition labels based on a standardized set of nutrition facts was implemented in 1994. They are regulated by the US Food and Drug Administration (FDA).

Updated Nutrition Facts

Regulations around nutrition labels on foods, and legally-allowable marketing claims have arguably been behind the times for well over a decade and have not kept pace with new product innovation. In a positive step forward, this year the Nutrition Facts Label received a significant overhaul. The updated label requirements have been designed to allow consumers to make better-informed choices in the interest of public health – accounting for the linkage between diet and chronic diseases such as obesity and heart disease. You may have noticed some of the obvious changes, such as the product calories being printed in a larger and in bold font. It’s important to understand what information the labels and packaging can provide. Here are a few deeper insights about nutrition labeling of which you may not be aware.

1: Some marketing phrases legally mean something, while others don’t.

Certain marketing phrases have a defined legal meaning per the FDA and can only be used on products if they meet certain criteria.

  • “Low Calorie” – no more than 40 calories for > 30g serving
  • “Light/Lite” – this one can have three different meanings. 1) For foods containing more than 50% calories from fat, the light version must be reduced in fat by 50%. 2) For foods containing less than 50% calories from fat, total calories in light version should be at least 1/3 less. 3) Could mean that the light product has 50% less sodium than regular version.
  • “Low-fat” – 3g or less of total fat per serving
  • “Fat-free” – < 0.5g of total fat per serving
  • “A good source of XX” – contains 10-19% of the Daily-Recommended-Value (DRV) in the amount that is typically consumed.
  • “High in XX” – contains 20% or more of the Daily-Recommended-Value (DRV) in the amount that is typically consumed.

As you can see, a “light” version of a food does not necessarily mean it is low calorie, but it’s probably lower in calories. The FDA is serious about labels that can be misleading. For example, if a food is labeled as no sugar or zero sugar, it must also place the statement on the label “not a low-calorie food” unless it also meets that criteria. Many consumers equate sugar-free foods with being low calorie – which is often not the case.

Many other claims utilized on packaging have no standard definition, and food manufacturers need to make sure they are not running afoul of the FDA so are careful in the way they state product features.

A prime example – you won’t see packaging that explicitly states a food is “low carb”. The FDA has no standard definition on what “low” means in terms of carbohydrates. Instead, the product will highlight “Net Carbs” (total carbohydrates less dietary fiber and sugar alcohols). This is a direct math calculation from from the Nutrition Label Facts and so removes subjectivity.  

Another work around is to portray a food as fitting within a type of diet plan without qualifying it, e.g. “keto-friendly” or “paleo-friendly”. These statements make no direct claims about nutritional value and benefits thus are allowable.

2: Serving sizes are larger for many foods in the recent label update.

Manufacturers must now reflect serving sizes based on the amount of food people typically consume, rather than how much they should consume. You will notice that serving sizes have grown larger. For example, a standard serving of ice cream is now 2/3 cup versus 1/2 cup.

It’s what the FDA believes is the average serving across everyone, including a 100 lb. 5’ 20-year-old female and a 250 lb. 6’ 55-year-old male. Considering this, the label serving size is not a recommendation of your portion. It’s important that you assess the right portion for you.

3: You may be getting more calories or nutrients than the package states, and there is allowable rounding.

Food companies have a lot of leeway in terms of the accuracy of their nutritional information. Calories and nutrients (including vitamins and minerals) are allowed a 20% variance. The accuracy of the information on the Nutrition Facts Label is the responsibility of the company selling the food, not the government. The FDA does go around sampling, purchasing, and analyzing products from store shelves to perform checks, but the extent and frequency of these checks is unknown.

Bottom line – it’s within legal bounds for a 200 Calorie packaged food to have 240 Calories (i.e. 200 + 20%). That being said, food manufacturers know it’s in their best interest to be a accurate as possible to keep customers happy.

The caloric value of a product containing less than 5 Calories may be expressed as zero or the nearest lower 5 Calorie increment. For example, a serving with 4 Calories can be reported as zero Calories. It’s truly rare that a food would have zero calories. Likewise, 47 calories would be rounded to 45 calories. You shouldn’t be concerned about these trace number of calories, but note they can add up if you consume a large quantity of “zero-calorie” and “low-calorie” foods.

4: The new “Added Sugars” line can be a very powerful decision-making criteria for food selection.

The new “Added Sugars” line can be immensely helpful in identifying foods that are intentionally made extra sweet to for no other reason than to be super tasty. Limit foods that have high quantities of added sugars relative to total sugar and total carbohydrates, unless you are specifically in need of a high sugar food for explicit purpose (e.g. fuel for endurance training, recovery from resistance training).

5: “Sugary” sweeteners don’t count towards “Total Sugar” or “Added Sugar” and they don’t have as many calories as typical carbohydrates.

Confused? The FDA’s assessment is based on recognition that certain sugar and sugar-like sweeteners are not metabolized by the human body in the same way as table sugar. However, they do count towards the “Total Carbohydrate” and you will often see them on a separate line item as “Sugar Alcohol”. While regular sugar is assigned 4 Calories/gram, certain other sugars and sugar alcohols are indigestible or only partially digestible and so their caloric value is assessed lower.  Everyone will derive a slightly different caloric value from many of these sweeteners depending on your own ability to digest them. Here, I provide a table of common sugary substitutes as well as the FDA’s caloric assignment.

SweetenerDescriptionFDA Caloric Assessment
AlluloseSimple sugar (epimer of fructose).
Our bodies can’t effectively metabolize allulose – it’s absorbed and passed in urine. No meaningful impact on blood glucose or insulin.
0 Cal/gr.
ErythritolSugar Alcohol. Our bodies can’t metabolize it – it’s absorbed and passed in urine. No meaningful impact on blood glucose or insulin. For some, it causes gastric distress due to fermentation in the colon.0 Cal/gr.
Mannitol Maltitol
Xylitol
Sorbitol
Sugar Alcohols. Our bodies can only partially metabolize them and they have a smaller impact on blood glucose and insulin versus sugar. These can also cause gastric distress due to fermentation in the colon.1.6-2.6 Cal/gr.

Hydrogenated starch hydrolysatesA mixture of sugar alcohols. Our bodies can only partially metabolize them and they have a smaller impact on blood glucose and insulin versus sugar. These can also cause gastric distress due to fermentation in the colon.3 Cal/gr.

You many also see sugar alcohols marketed as a reduction in total carbohydrates for lower “net carbs” or “impact carbs”. Personally, I would not categorically call sugar alcohol-containing products “free foods.” Some of these products can still contribute a significant amount of carbohydrates.

6: Some dietary fiber has calories. Also, fiber does not have to be “natural” to be beneficial.

Soluble fiber is partially digested in our gut and is assigned 2 calories/gram. On the other hand, Insoluble fibers travel to the intestine with little change and are not digested in any meaningful way to are assigned 0 calories per gram. Both are important to our diet.

Dietary fiber that can be declared on the nutrition label includes naturally occurring fibers from plants as well as certain isolated or synthetic non-digestible soluble and insoluble carbohydrates that have been approved by the FDA. Both natural and synthetic fibers are beneficial for meeting fiber intake. You may have come across ingredients such as glucomannan, beta-glucan soluble fiber, psyllium husk, cellulose, guar gum, alginate, inulin, soluble corn fiber/resistant maltodextrin, and locust bean gum. These all count toward dietary fiber and are typically added to products to promote feelings of fullness.

Did any of this surprise you? Let me know and please forward this to friends who may find it interesting.

Need a plan and support to improve your physique, strength and energy? There’s no better time than now to invest in yourself – click here to get started.

Posted on

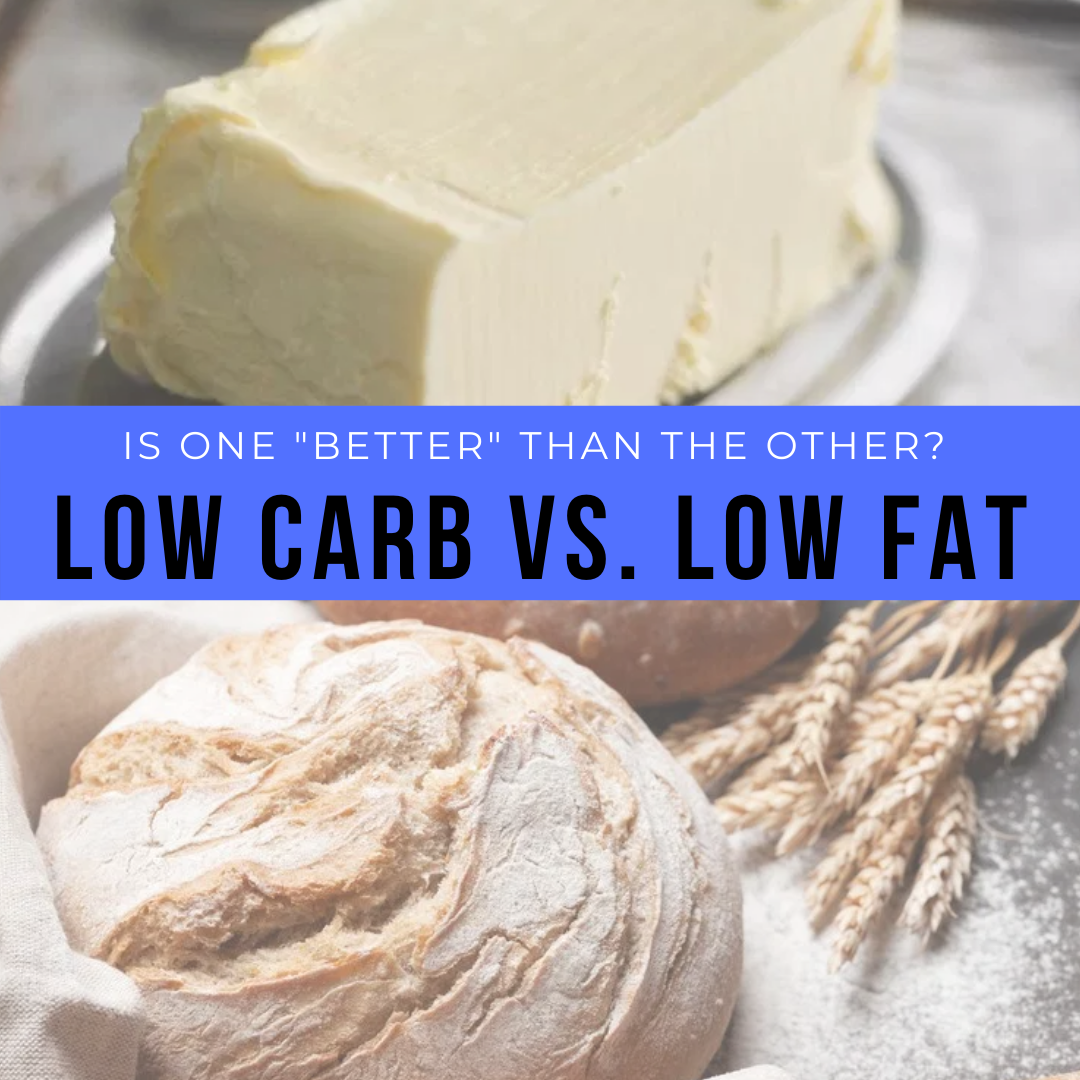
Low-fat vs. Low-carb

Low Carb Low Fat
Low-fat vs low-carb diets

Low-fat vs. low-carb diets….is one better than the other? You’ve likely come across stories about going low-carb or keto for more effective weight loss. These stories create confusion more than they help, so let’s clear the air by reviewing a few concepts.

1. Eating carbohydrates does not make you inherently gain fat.

Carbohydrates raise blood glucose (and therefore insulin) which suppresses burning fat for energy, but this is not the same thing as fat gain. Burning fat (the breakdown of fat for energy) is NOT the same thing as body fat loss. The fuel that your body burns day to day for energy is a matter of what fuel you are giving it:

  • If you eat a higher fat diet, you burn more fat AND store excess fat if you are in calorie surplus
  • If you eat a diet higher in carbohydrates, you burn more carbohydrates AND store more carbohydrates as glycogen, and then surplus converted and stored as fat

2. “Calories in < calories out” is an oversimplification of how weight loss works. Equally incorrect is “calories don’t matter, hormones control weight loss”.

Both matter to varying degrees. Food quantity and composition influences our hunger and satiety hormones (among others), and vice versa. These hormones are released from different locations in our bodies and send signals to our brains which in turn drive feeding cues, energy expenditure, and release of other hormones.

While a net calorie deficit is required, calorie intake and expenditure influence your particular hormone levels to a different degree than someone else, and likewise your hormone levels have a varying degree of influence over your calorie intake and expenditure. This recognizes that it can be more challenging for some than others to create a calorie deficit.

Type of calories have implications on your energy balance, body weight, and body composition. The way intake calories are partitioned between protein, carbohydrates, and fats AND specific foods selected within those categories have different capabilities to impact hunger and fullness. They also have different energy costs to digest, absorb, and metabolize. For example, appropriate protein intake supports lean mass retention and a small degree of additional spontaneous energy expenditure (energy cost of protein digestion).

3. Effective weight loss can be achieved with a higher carb, lower fat diet or a lower carb, higher fat diet.

Some people find that they are less hungry and it’s easier to stick to a lower carb diet, while others feel more satisfied eating more carbohydrates. If you are training hard and trying to lose fat at the same time, you may want to consider keeping your carbs relatively high at the expense of dietary fats to to fuel your performance.

The Carbohydrate Insulin Model posits that diets heavier in high glycemic load carbohydrates shift body homeostatic mechanisms towards fat gain and therefore a lower carbohydrate diet is more effective for weight loss. Specifically, a higher carbohydrate diet increases insulin levels to promote energy storage in fat cells. Increased adiposity creates hormone dysregulation leading to increased hunger and reduction in metabolic rate.[1] This model is not supported by well-conducted studies. In reality, effective weight loss can be achieved with a higher carbohydrate, lower fat diet OR lower carbohydrate, higher fat diet. A meta-analysis of controlled feeding trials (calories and protein held constant) indicates that differences in weight loss between a low-carb and low-fat diets are not statistically significant [2] or in one example may lean slightly in favor of low-fat diets as it specifically relates to fat loss.[3] In a population with abdominal obesity and metabolic syndrome risk, a one-year study indicated that a low-fat isocaloric diet is equally as effective as a very low-carb diet for weight loss.[4] Further, a 12-week crossover study[5] with overweight, postmenopausal women also concluded the same, in addition to no significant lipid, insulin, or glucose differences between the two diets.

4. Tracking food intake and calories is not a requirement for weight loss, but it can be a helpful tool for some.

For weight loss you must consume less calories than you expend, but you do not need to quantify it by measuring food and logging calories. Tracking is helpful for some, but a possible detriment to others. Consider your dieting history and potential for disordered eating behavior. Consistent and frequent self-monitoring has some association with weight loss and improved weight maintenance after weight loss.[6] Tracking food intake may improve awareness about what you’re eating.

As you consider the right diet plan, decision factors should include practical ability to adhere and satisfaction, activity level, and health considerations.

Elimination of specific foods or food groups can be challenging to stick with, and at worse could lead to all out binges on foods self-deemed as “bad”. Labeling foods as “allowed” and “not allowed” creates unnecessary rigidity and more likely a negative outcome in long-term weight management. While it may be easier to think of food in good/bad terms, it’s better to instead regard all foods on a spectrum from being “less aligned with my goals and health” to “more aligned with my goals and health”. Seek professional advice if you have concerns and specific circumstances that need attention.

Diet planning is not one size fits all. But please, do not be scared of eating fruit! Contact me if you’re looking for a balanced strategy and plan.

For more tips, please follow me on Instagram and Facebook.


[1 Ludwig, D.S., Ebbeling, C.B., “The Carbohydrate-Insulin Model of Obesity: Beyond Calories In, Calories Out., JAMA Intern Med. (2018), 178(8), 1098.

[2] Hall, K.D., Guo, J., Obesity Energetics: Body Weight Regulation and the Effects of Diet Composition” Gastroenterology (2017), 152(7), 1718.

[3] Schick, A.; Boring, J., et al., “Effects of Ad Libitum Low Carbohydrate Versus Low Fat Diets on Body Weight and Fat Mass”. Current Developments in Nutrition (2020), 4(2),658.

[4] Brinkworth, G.D.; Noakes, M., et al., “Long-term Effects of a Very-low-Carbohydrate Weight Loss Diet Compared with an isocaloric low-fat diet after 12 months”. Am J Clin Nutr. (2009), 90, 23.

[5] Segal-Isaacson, C.J.; Johnson, S., “A Randomized Trial Comparing Low-Fat and Low-Carbohydrate Diets Matched for Energy and Protein”, Obesity Research, (2004), 12 130S.

[6] Peterson, N.D.; Middleton, K.R.; et al., “Dietary self‐monitoring and long‐term success with weight management”, Obesity, (2014), 22, 1962.

Posted on

Boredom and Emotional Eating

Boredom Eating
Emotional Eating

In this post, we will discuss boredom and emotional eating – why we eat to alleviate boredom, and how to deal with it.

Boredom is a discrete emotion associated with feelings of dissatisfaction, restlessness, lack of progress towards goals, and/or not feeling challenged. It is an emotional signal intended as a trigger to help us re-identify our sense of purpose. However, these emotional signals are indiscriminate and do not help us decide where we should be focusing our attention….so boredom can become a positive or negative.

In this light, the difference between success and failure is not avoiding boredom itself, but rather how we react to boredom. Boredom is often experienced when we have little control over our situation. At the onset of feelings associated with boredom, a common short-term reaction is to escape self-awareness by finding an empty distraction to disconnect from negative feelings and alleviate the discomfort.

The link between boredom and eating

The perfect example is boredom eating – the excitement and stimulation of certain foods helps to distract our attention from our bored selves! Based on a limited body of research, here are a few things we understand about the link between boredom and eating:

Boredom markedly increases food consumption for individuals of normal body weight as well as the obese.

Boredom promotes an increased desire to snack.

Boredom promotes preferences for less healthy foods.

Obesity is more prevalent among those who regularly experience boredom, compared with other negative emotions.

While eating (or binge-watching Netflix, endlessly checking social media, playing Candy Crush, etc.) will distract your attention and make you temporarily forget you are bored, they will not alleviate the underlying cause of boredom. To alleviate boredom, we must work to focus our attention on meaningful and productive activities. Don’t distract yourself from boredom – face it head on. Here are some examples purpose driven, task-oriented activities that will relieve boredom and reduce the risk of boredom eating:

Here are some examples purpose driven, task-oriented activities that will relieve boredom and reduce the risk of boredom eating:

Prepare your meals as if it were any other day. (Although I am home, I am maintaining the habit of keeping my meals prepared and in separate containers in the fridge, even though presently I’m conducting more of my business virtually).

Get in your workouts as usual. If you don’t have access to your usual routine, consider using the time to focus on development of a certain skill.  

Re-engage with a a neglected project or hobby.

Tackle your “to-do” list around the house – reorganize you closet, take on a repair project, initiate spring cleaning.

Write a handwritten letter to a distant relative or friend – it’s a lost art and the person receiving it will feel very special!

Take an online course in a subject that has always interested you, or for personal/career development.

Look for ways to support your community  – grocery delivery to seniors, start a donation pool for those who have lost or may be at risk of losing their jobs to ensure they have enough food money week to week.

Optimize your household costs – are you still getting the best deal on cable, insurance, etc.? Shop around and make sure your rates are competitive.

Refresh your personal and family long-term vision and roadmap – are your 1, 5- and 10-year goals still the same?

Work on your personal brand and update your CV. Some of you may be concerned about employment so it’s a great time for a re-fresh. Even if you are not seeking employment, it is always a good idea to maintain your resume. (as a business coach to executives across the tech, financial, and health space, I can help develop your personal brand and generate highly impactful resumes, email me to discuss.

If you feel that your attention is in a productive direction yet emotional food cravings are still high, distractive tactics include going for walks, chewing gum or brushing your teeth, consuming extra water (this is a good idea in any case as it relates to maintain your health), taking a nap, and spending a few minutes mindfully meditating.  

Capitalize on this time by engaging in developmental pursuits and focus on meaningful tasks that bolster your sense of self-worth. Use your healthy habits to keep you grounded!


There is no better time than now to focus on your health and well being. Contact me to explore nutrition coaching.

Further Reading

Moynihan, A.B., can Tilburg, W.A.P., Eaten Up by Boredom: Consuming Food to Escape Awareness of the Bored Self, Front Psychol., 6, 369 (2015).

Bench, S.W., Lench, H.C., On the Function of Boredom, Behav Sci., 3, 459, (2013).

Abramson, E., Stinson, S.G., Boredom and Eating in Obese and Non-obese Individuals, Addict Behav., 2, 181 (1977).

Eastwood, J.D., Frischen, A.; Smilek, D., The Unengaged Mind: Defining Boredom in Terms of Attention, Perspect Psychol Sci., 7, 482 (2012).